Google Analytics is a powerful tool but the sheer amount of information available can make it hard to know where to start, let alone knowing how to get value out of it to inform your marketing.
Accounting firms that want to better understand their audience, and strengthen their marketing strategy, will need to make smart use of the data available in Google Analytics.
With advanced customisation such as filters and goals, Google Analytics can be tailored to track the success of your firm’s specific marketing goals and return on investment. But customisation requires a relatively advanced understanding of Google Analytics and other tools such as Google Tag Manager.
So what can it tell you out of the box to measure success and return on investment?
In this article I’ll highlight the most important sections in Google Analytics, and how to use them to inform your marketing.
Before I get into it, though, a quick note: Analytics only gives you so much. It’s great for finding what’s happening with your marketing and website. What it won’t tell you is why it’s happening. Other methods such as usability testing or screen recording software can reveal that.
What are the important sections?
Each section has its own story to tell about how your accounting firm’s website and marketing is performing but let’s focus on three: audience, acquisition and behaviour.
These sections don’t require any customisation to start providing useful info to inform your marketing strategy.
1. Audience
What’s this section about?
Like any business, you want to make sure you’re getting traction and interest in your accounting firm. Knowing the volume of traffic to your website is key, it’s also important to know if that traffic engages with you once they land on your site.
With details on traffic volume, high level engagement metrics, demographics and different behaviour., this section provides you with a strong indication of whether you’re driving substantial amounts of relevant traffic.
There are some useful subsections here, too.
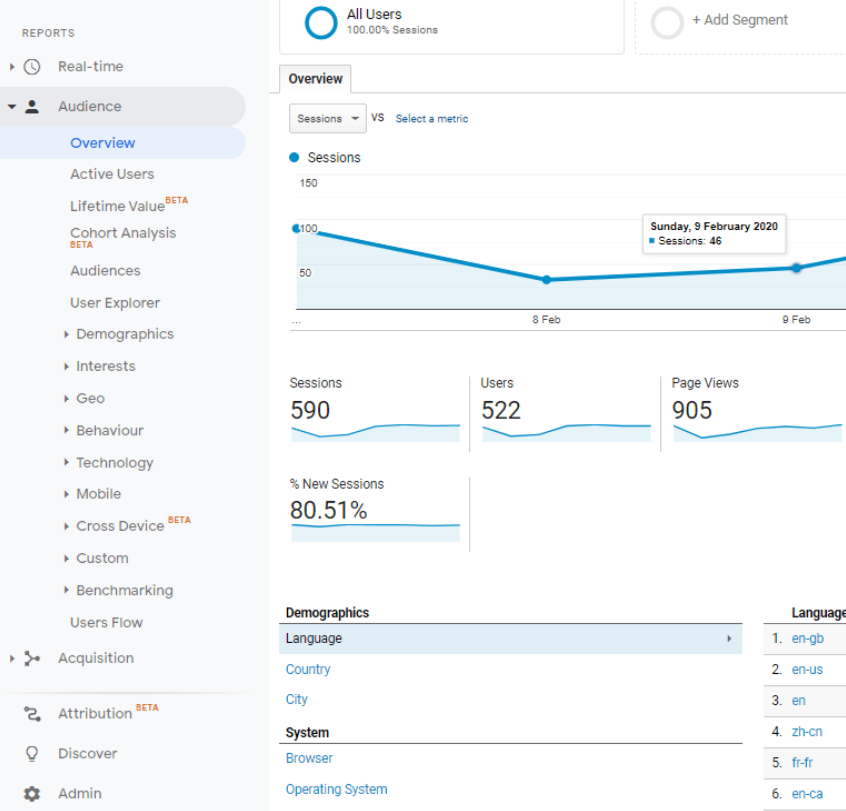
Audience > Overview
The summary indicates quickly if you’re attracting enough traffic to your site, how relevant the site might be and gives a high level temperature check on engagement.
The users metric on the dashboard view gives you traffic volume. Changing the date range will help you assess how your marketing has performed in attracting traffic over a given period.
Looking at pages, bounce rate and session duration tells us about the level of engagement of that traffic.
You can then assess if you have a traffic problem, engagement issues, or both.
For example, if your traffic sits below what you might expect, you need to think up ways to generate more traffic. Focusing on building volume before engagement and conversion is a sensible approach. One way to generate more traffic is being visible in search engines.
If you feel you have a healthy volume of traffic but your average bounce rate sits well over 50% and/or you see dwell times of less than a minute, you probably have an engagement or relevance problem. In other words, either the content or the audience is wrong.
This section will help you answer the following questions:
- Are we attracting enough traffic?
- Are they engaging with us?
If the answer is no to either of these, the other sections will pinpoint where you need to improve.
Want to know what good looks like? Working exclusively with ambitious accounting firms to drive marketing performance means we are uniquely placed to talk you through what you should expect from your marketing. We have hundreds of data points from the accounting firm websites we host and marketing activity we undertake on behalf of practices. That allows us to create digital benchmarks specifically for accounting firms. Contact us today to understand what traffic volume, bounce rate session duration and most importantly conversion rates you should expect, and how your current marketing measures up. We’ll give you ideas and a plan to help boost your marketing.
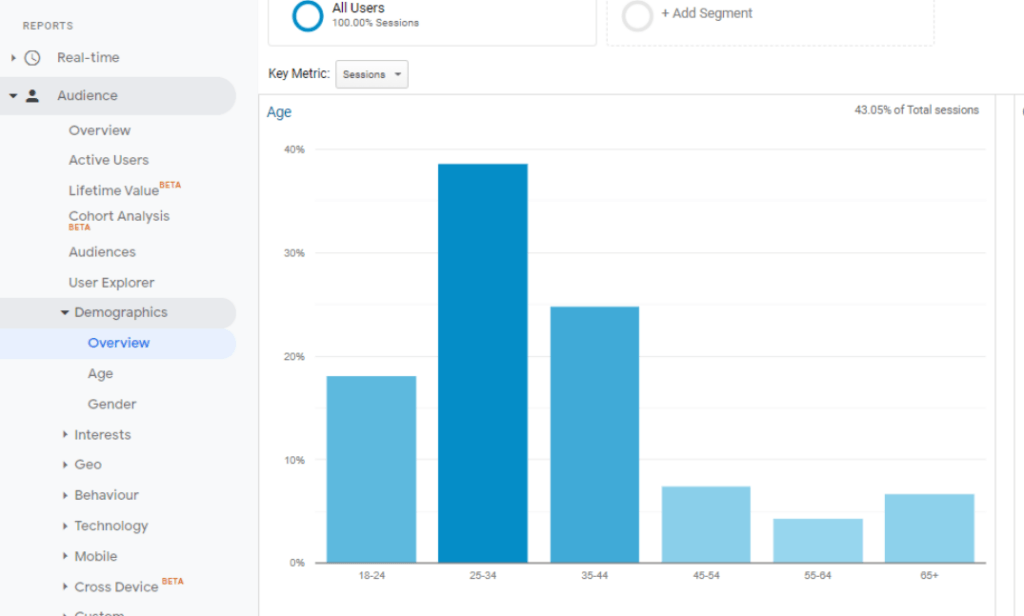
Audience > Demographics
This section tells you about who is visiting your site.
Knowing if you’re getting enough traffic to your website is important. But it’s not just a volume game – you need to know if you’re attracting the right types of clients.
You might have an idea of your target client. If so, you can use this section to see if that matches with who’s visiting your site.
If you don’t have any idea of the demographics of your target market, however, this section is real gold dust. Rolling your mouse over each bar in the graph will show you the traffic percentage of each age group.
This section will help you answer the following questions:
- Does the age/gender match my target client assumptions?
- Am I attracting the right type of prospects?
- Is our marketing reaching the right demographics?
If you assume the majority of your clients are male aged between 45-54 but your analytics is telling you your traffic is mostly female and aged 34-44, that’s worth knowing.
Speak to those who are picking up the phone to prospects – are they starting to see a shift in your client base? Or are you simply attracting the wrong type of clients through your marketing?
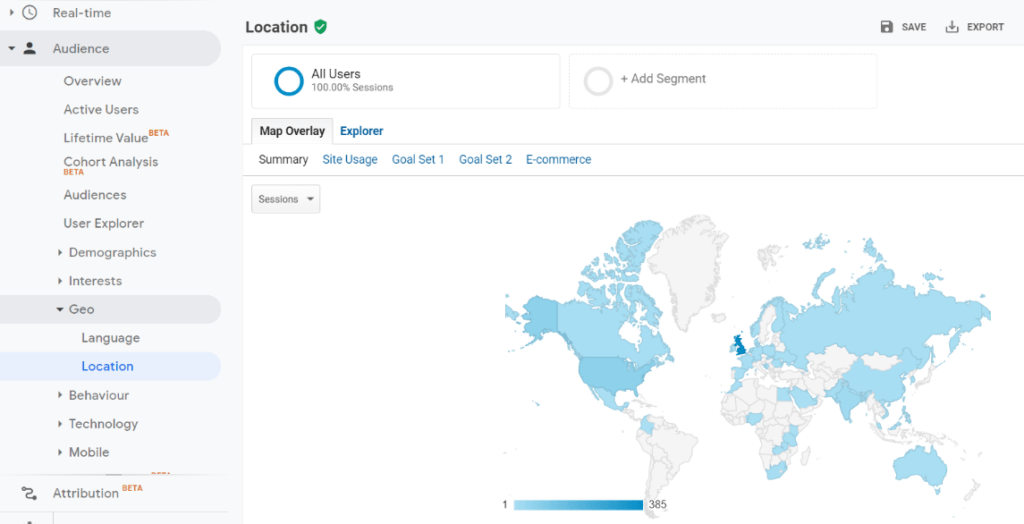
Audience > Geo > Location
Knowing where in the world your traffic is coming from and what percentage is coming from your target locations is critical.
You might find 40% of your traffic is coming from outside the UK. If you’re only interested in marketing to UK businesses, you need to discount the rest of that traffic from your Google Analytics results.
If you know how to setup a filter, I would recommend creating one that excludes traffic from outside the UK.
This section will help you answer the following questions:
- Where in the world is my traffic coming from?
- What cities are driving traffic?
- Am I attracting national or local traffic?
Clicking on England, then setting the primary dimension to City, means you can see the most popular cities and traffic volumes to your site.
Knowing which cities drive traffic can help inform a number of marketing activities.
For example, if you’re expecting local coverage, you might want to dial in your search engine marketing strategy around local keywords to boost traffic in the relevant areas.
Location data could also support knowing where to run targeted location-based social media ads, or indicate where to run offline events.
2. Acquisition
What’s this section about?
This section is going to give you a good indication of whether you’re persuading and attracting future customers through your marketing funnel.
Under the acquisition section, you’ll find information on different traffic sources, such as organic search, paid media, social media and people coming directly to your website by typing in the URL.
This section is key to answering the question of where you are acquiring new visitors from, the level of engagement from that channel and, if you have goals setup, which channel converts more traffic.
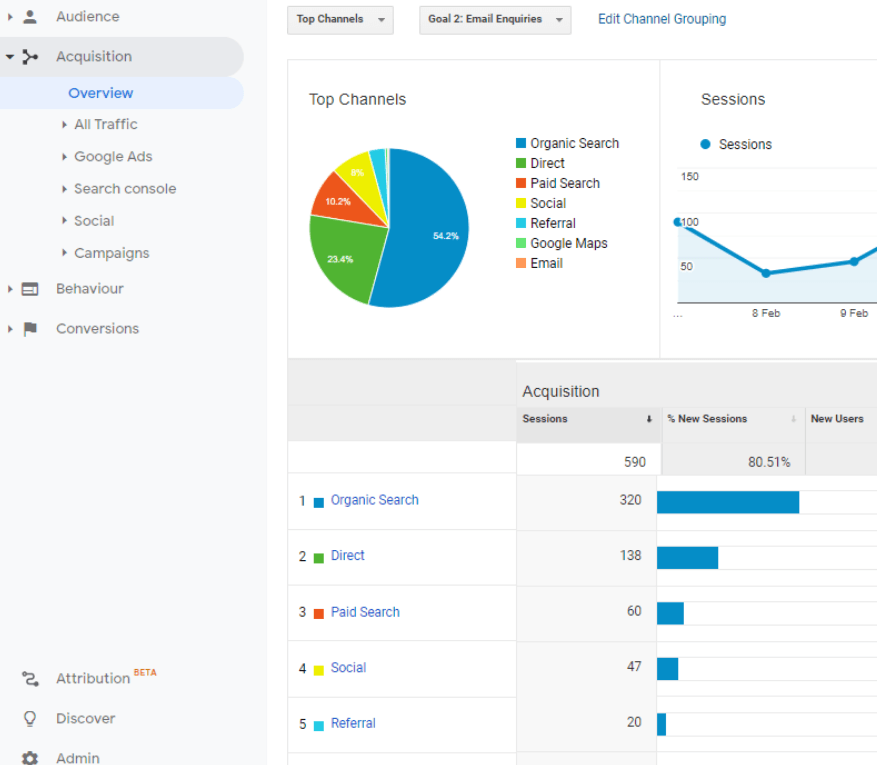
Acquisition > Overview
The pie chart indicating the top channels is self explanatory. However, the page becomes particularly useful in the table which lists the acquisition, behaviour and (if you have goals setup) conversions.
You can also see the site sessions broken down by channel source. With the sites average bounce rate compared to each channel bounce rate. This is handy to see how useful users from each traffic source find the page they land on.
Not only do you see which channels are getting traffic but it also gives you a good indication if your landing pages match user expectations. Do people get what they’re expecting to find when they click that link in Google search results?
A high bounce rate could mean you are not quite hitting the mark with your content. You may also find users aren’t going through from where they land to other pages suggesting you need to take a look at your calls to action (CTAs).
This section will help you answer the following questions:
- Which marketing channels are working?
- Which channel drives what type of engagement?
- Which channel converts more traffic?
Acquisition > All Traffic > Channels
At a high level in this section you’ll see how each traffic source performs. Where it gets really interesting is by clicking into a particular channel.
When you do that and select the primary dimension of the landing page you’ll quickly see which pages are bringing in traffic from each source, and the level of engagement. Those of you with goals set up will be able to see which individual page converted the most traffic.
This section will help you answer the following questions:
- Which traffic sources do I need to work on improving?
- Do I need to drive more traffic, improve engagement, increase conversions, or some combination of all three?
For example, if you have a good volume of traffic from a particular source, but a high bounce rate, you should start to optimise your landing page to better meet the needs of your target clients.
However, if you have a low volume of traffic from a source you know should be higher, you really need to spend time driving traffic before you can make a call on the effectiveness of the landing page. Look at your outreach activity, ad copy, SEO rankings, social media activity etc.
Tip: Make sure you have relevant landing pages setup. There’s no point sending all your traffic to your homepage, especially if you’re trying to sell a specific service. If you’re advertising a particular service make sure your advertising links through to a page that provides real detail and a specific call to action.
3. Behaviour
What’s this section about?
The point of Analytics is to help guide your decisions. Knowing if your content marketing is working and your services are attracting prospects is critical to marketing success.
The behaviour section of Google Analytics will help you assess if your accounting firm’s content marketing and key pages are performing in attracting prospects, their level of engagement with your content and, if you have goals setup, it’ll tell you what’s driving conversions.
Behaviour > Overview
First let’s clarify what the metrics mean. Page views indicate the total number of visitors looking at the same pages more than once on your accounting firm’s website, whereas unique page views counts just a single page view rather than the repeated visit to that page by a single user.
This section will help you answer the following questions:
- What’s the overall health of our content marketing activity?
- Are our key landing pages in the top 10 pages?
- Did we have any traffic spikes at certain times of the month or year?
- Which content created those spikes?
Behaviour > Site content
Each subsection within the site content section has valuable information to dig into content performance. You’ll find content drilldown, landing pages, exit pages all have valuable information to assess your content marketing efforts.
Knowing which pages attracted the most traffic and which had the most people exiting supports your marketing by indicating what to do more of, what to tweak and possibly what to stop doing.
This section will help you answer the following questions:
- Are my core services driving traffic?
- Are the campaign-specific landing pages driving traffic?
- Which content isn’t performing?
- What should I do more of?
- Which pages or content do I need to fix?
- What should I stop doing?
Make sure you’ve got clear calls to action on every page. Ask yourself, “What one thing do I want the visitor to do after this page?”
Typically you’ll want to see your service pages and contact page in the top ten. If they’re not, you need to work on driving traffic to those pages from off-site and better signposting from other pages on-site.
You should also be wary of bounce rates on your blog. You may find the blog section has a higher bounce rate than other areas. That’s fairly normal given the nature of content. But look at repeat visits to see if it’s bringing the same people back – a great indication that they find your content useful in their day-to-day working life.
Summary
Data should be used as an indicator to inform your marketing strategy and tactical plan.
Asking questions of your data means you’ll have a clearer objective when assessing the metrics. Once you get to know your data, you’ll have a better understanding of what’s typical and what needs work.
Optimising marketing performance takes time. Adopt a test-and-learn approach.
Don’t stretch yourself too thin – trying too many new initiatives could lead to feeling overwhelmed and not giving each approach proper focus.
Key takeaways
- Make sure messaging reaches your target clients.
- Ensure marketing messages answer key challenges and questions.
- Match marketing messaging to landing pages.
- Dial up the channels that work.
- Stop marketing to channels that consistently under perform.
- Adopt a test-and-learn approach when making improvements.
- Use data to track changes and inform activity.
- Don’t try too many new things at once.
Like and share using the buttons below.